Lifetime Value in the Real World
[1:35] The “magic” formula of [Lifetime Value] > [Cost of Customer Acquisition]
[2:45] LTV in the real world: example of an athletic recruiting business
[6:27] LTV formulas
[9:12] Why is LTV important?
[12:55] About the Podcast: Guests
[13:34] About the Podcast: Giveaway!
[15:35] How to Calculate LTV: People-Based Tracking, Cohort Reports, Quartile / Decile Analysis
[22:39] Whales
BRIAN: Hello, and welcome to MatchCast this is the inaugural podcast for Matchnode digital marketing I am Brian Davidson
CHRIS: I am Chris Madden
BRIAN: Welcome Guys, well hopefully we are getting a whole huge audience listening to us for our inaugural podcast and this is going viral. Hopefully we’re going to give you guys some great content for today, and you’re really going to like and you’re going to pass it on to your friends.
Our inaugural topic is going to be lifetime value, but just a little bit about us before we get going, so you know what we’re talking about is legit.
Matchnode is a digital marketing agency, we’ve been in business for just over two years now. But Chris and I have a wealth of experience and a lifetime of experience in both the marketing world, sales world, and more importantly the digital marketing world.
CHRIS: Yeah so we’ll get into a little more about us and about the pod in a little while, but let’s start by getting right into the meat of the topic today which is about lifetime value.
Lifetime value is kind of part of this magical formula, this mythical formula that in our work, for years, the idea that the lifetime value of your customer is greater than the cost that it takes to acquire that customer, than you are cooking with gas. You are in business, you’re making money, profit. You did economics on a person by person, or sale by sale basis. The value you’re getting, is greater than it’s costing you to acquire that person.
BRIAN: Exactly, so if you’re selling a widget, you don’t need to worry about your marketing cost falling within the profit margin of the initial widget. If somebody buys 35 widgets, you can spread out the marketing cost over the lifetime of their purchase behavior for your product.
CHRIS: Yeah, so I mean it’s a bit of a magical formula because it’s something that earlier in my career I heard discussed much more almost a hypothetical or theoretical way. It’s easier to get your mind around than actually be in a business situation where you are able to apply it and measure it and kind of find that actual LTV greater than acquisition cost moment, is harder to get to and actually a little rarer.
BRIAN, I believe in some of your past work experiences, I believe you’ve seen that situation where you’re able to find that inflection point, and once you’ve seen it you can kind of put your foot on the gas, I mean it’s funny how many potential clients of ours will say “Well if the marketing, you know, if it’s profitable I’ll spend tons of money” and everybody I think is like “of course if you make money on every single dollar you spend in marketing, who wouldn’t do that.” The reality is it is a little harder to get there than people make it sound.
BRIAN: So my first job in digital marketing was working for a company that helped kids find sports scholarships. We were basically a match.com for high school athletes trying to find the right college program for them and I worked on the digital marketing team there. And like Chris said we hit an inflection point when we realized exactly what our unit economics were to acquire a lead and close a lead. And the metric we actually used, was percent of cost sale. We knew certain leads wouldn’t close as well as others because they were from sources that were on the internet that weren’t as high quality.
Traditionally the way we would generate the leads is we would send a high profile athlete into a high school and they would talk for an hour in front of athletes and their parents and they’d send us postcards in the mail. Obviously those leads closed a lot better having an hour long talk then someone finding us on Facebook.
But we were able to find the exact close percentages for all the different leads that were coming in the funnel. And as soon as we found the close percentages and once they were within our percent cost of sale, we knew that if we got a lead from anywhere, it’d be profitable. We knew exactly the percentages we needed the hit.
CHRIS: So in “percent of cost sale”, can you explain that a little more clearly, say if it was a hundred dollars, kind of give some simple numbers on what that means.
BRIAN: Sure, the most important piece was understanding our close percentage. Leads that came from the internet I knew wouldn’t close as well as leads that came from the speaker. Therefore, I could afford to pay a speaker lead much more money. One they would close much more quickly, but two, I would also waste, or spread out our marketing cost across the internet much greater because it wouldn’t close out as well.
Very simple example. I could buy 800 leads for a dollar on the internet but I knew they’d only close at 10%. So out of those 800 I’d close 80, but it would cost $800. And that was fine, it hit our threshold, but for a speaker lead I could pay almost $50 dollars because they’d close about 50% of the the time. So that was all factored in to our percent of cost sale and understand our closing percentages.]
CHRIS: So depending on where the lead came from, you’d be able to say, ok these speaker leads, you know, in the end are costing us 10% of sales, is our lead cost all in for however many you closed, however many leads that you didn’t close you’d be able to figure out what your cost was to do all of that.
BRIAN: That’s exactly right Chris.
CHRIS: and then there were other channels whether it was affiliate…and you could measure the percentage of cost that would go into each one of those types of leads.
BRIAN: And we knew exactly where we were profitable, and once we hit those marks, we could go to anyone and offer them dollars for their leads. We knew where our thresholds were, where we could make money, and where we couldn’t make money. And now the key to all that though was understanding our LTV.
CHRIS: So we’ve talked a bit about our cost of the greater than, less than formula where cost is less than LTV. Did you guys have a relatively simple, straightforward business where you could understand LTV because some businesses are harder than others to get your mind around what is a customer worth?
BRIAN: Sure, ours was a little bit unique in that it was a one-time purchase. A customer wasn’t going to buy a scholarship or buy help for a scholarship a second time, it was really a one-time purchase. We might add on a few things here and there and we did add those into our calculations for add on for extra help or the athletes paying for extra services or an extra video or something they needed a little extra for. And we certainly knew those calculations was about 1.1 average purchases. We knew our average purchase price and we could factor that across all of our athletes and across all of our sources. We knew a certain source would pay us ‘x’ amount of revenue 1.1 times and we knew the exact cost of sale for that lead and therefore that allowed us to scale very very quickly.
CHRIS: Cool, you’re throwing some numbers around that we’re making up as we go just for some examples, but the reality of this LTV calculation is that it is a calculation, there are formulas involved. There is a lot of nuance in LTV but the reality is that you can kind of break it down into numbers and where you get those numbers and the assumptions behind those numbers is a whole other discussion to have within each business, as BRIAN is mentioning in his example with the athletes leads.
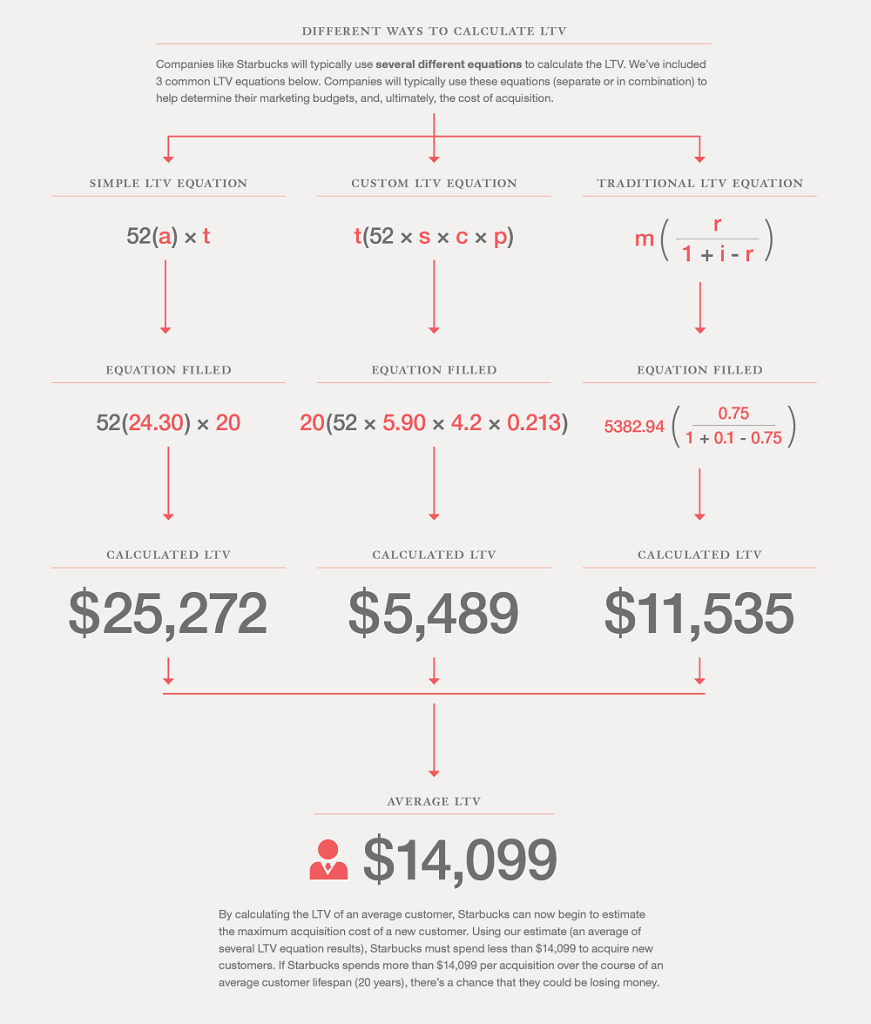
However, there are a few different formulas and we will include these formulas in the posts around this episode. But there are a few different formulas that we come across and see regularly that we consider when we are helping a client or business calculate LTV. But first we want to use lifetime revenue, it is pretty simple. If you know your product costs $100 and people buy it once a year, and the average person stays for 5 years, your lifetime revenue is $500.
And so, it’s rarely that simple, yet that’s the concept. People will often say, “My lifetime value is $500 per customer”; what they actually mean, you have to have a deeper discussion to get around what they actually mean by that. But what they actually mean in that case is how much money we get per customer. Obviously, you want to go deeper than that.

BRIAN: Sure, and maybe we can take a step back. None of these calculations are even possible unless you are keeping great data and you are keeping great records on your customers.
A lot of times people especially when they are starting on a business are so willing to make a sale, but don’t have the backend infrastructure necessary to make these calculations down the line, and they really want to start understanding their marketing costs. So it’s so important even from the very beginning to have a great sales database, or have a great database on your actual revenue you have coming in and tying that to an actual person.
CHRIS: No doubt, it’s really important that as soon as you start, you’re tracking your data. Almost everyone who we come across who’s analytics we dive into, whether they’re a client or whoever they might be, has some deepening or improvement of analytics that is possible. Frankly, we probably could put our own tracking in the same boat, but it’s really hard to have that discipline that BRIAN mentioned where you are immediately tracking your data.
The sooner you track it the sooner you are able to calculate these things. We’ll talk about a little more in a how-to section, and how you would actually calculate this. But the first step is to collect the data properly, which also can be harder than it sounds.
BRIAN: Sure, and remember, what is your end goal? Your end goal is to be able to scale very very quickly and understand your marketing costs. They always say, half of your marketing budgets is wasted, you just don’t know which half. That’s great and you’re able to waste half in theory, if you have a handle on your costs to begin with.
CHRIS: Yeah that’s a good point which is answering the question “Why.” Why would we want to calculate something like this or why would it be important? Hopefully it’s clear in the case with BRIAN’s example of student athletes, as soon as you know what these numbers are, you can actively put your foot on the gas as far as these marketing expenses go or whatever the case might be, knowing that it’s a profitable spend.
BRIAN: Or even investing in new pieces of equipment for your business
CHRIS: We had a client recently who we were doing this work for say, “Ok well, why do we want these numbers, what are we going to do with it?” Actually their assumption was, and this is reason number two I think to know this for almost any piece of data, is to know the baseline.
Like our baseline LTV is $180 over two years for a customer. And now you know the baseline in that we’re going to do a variety of things to extend and improve the lifetime value, whether you’re doing up-sells like you were talking about in the athletic recruiting business or an increase in pricing, or better targeting, or refined marketing tactics. All these different things would serve as a way to improve your LTV and you’re not going to know if that’s happening unless you have your baseline.
BRIAN: It even can be to track something as simple as customer service, are you giving your customer better service as whole and is that lifetime value increasing?
CHRIS: Or maybe you start segmenting your customers based on what their lifetime value is. And you may find that your bottom 25% of customers as far as your LTV goes is where you are putting in most of your customer service effort and dollars and maybe you have some segment of customers at the bottom of your lifetime value kind of sorted spreadsheet that are unprofitable. And so there are all sorts of sometimes it’s even surprising, ideas that come up when you start digging into these numbers.
CHRIS: So this gets a little bit into the “how to” piece of different ways in which you’ve got to understand your customers. So the first formula as we’ve mentioned is just revenue centric, it’s a very simple calculation, my value is $500 per. It’s pretty obvious what is lacking in this revenue-centric lifetime value formula which is your cost.
Every business has cost; some business has pretty set cost of product. If you’re selling a widget and it costs you 50 cents to make and you sell it for a dollar than you have a 50% cost to product so it would be pretty common sense to just take that 50% off of your $500 LTV and say well ok I get $500 revenue from this product but I knew immediately 50% of that goes out the door with my cost of product so I know that $250 is a more useful number than $500.
Another nuance that gets very often added to the mix after you’ve taken your lifetime revenue and your profit margin is the time value of the money. So if you are spreading this money and this revenue over five years, we know that this revenue is worth less than the revenue today. So you can apply a discount rate, and so profit margin with a discount rate for those cash flows in future years is another piece of the formula. These formulas and some links to some good pages that run through these details will be in the resources section of the podcast.
You mentioned “percent of cost sale” as far as the leads you’re talking about within the athletic recruiting example, can you explain that a little more?
CHRIS: Alright so we’ll take a minute here since this is our inaugural episode to mention a couple thing about the podcasts. We’re going to develop this as we go, hopefully with some feedback from you about some things you’d like to hear about. Certain episodes or things that we are talking about that are interesting to you that you’d like us to draw more out of. We will certainly really value any feedback you may have for us on that front.
BRIAN: If you have any questions, or advice, topics you want to see covered, one on one advice you want to get from us, we’re all happy to do that for you guys.
CHRIS: And one of the reasons this came up apart from wanting to interact more with people who might be interested in some of the things we talk about and do on a daily basis, is we wanted to have the chance to bring some guests in, some of our people that we look up to and are interested in working with or like working with who we’ve heard talk about different subjects and bring them in and really let their point of view and their experiences guide certain episodes. So there will be guests, these first couple, thanks for bearing with us as guinea pigs, these first couple episodes will be BRIAN and I, but as time moves on we will have great guests to put out some great conversations for you.
BRIAN: We’re going to be giving away different stuff on every podcast we do out there. On this podcast we will be giving away one month free of mixpanel. Which is actually one of our favorite tools for trying to understand lifetime value and understand people purchasing habits. The way you can win that giveaway is hit us with a Snapchat.
CHRIS: Sure, basically hit us on Snapchat, our Snapchat username is matchnode and ask us questions about this podcast, something that you wondered about as it relates to lifetime value, any question you may have. Send us your submission on snapchat at matchnode and we will answer those. Pick out our favorite
BRIAN: M-A-T-C-H-N-O-D-E Matchnode

CHRIS: Yeah so hit us up on Snapchat with a question, we’ll pick out our favorite question and give one month of mixpanel. Mixpanel is free at a certain level, of course we are going to help you out with that first paid level which I think is $150 a month. So hit us up on Snapchat.
At the end of each episode, we’re going to take each episode, transcribe it make it easy to take apart if there’s only certain pieces of the conversation you’re interested in getting to at a particular moment, and then at the bottom of those blog posts we will have resources and links to some of the things we have talked about so you can dig in deeper to some of our source material, some of the things we might have referenced. In this case with LTV the formulas are a little easier to understand when you’re looking at them rather than hearing us explain them so look out for your resources at the bottom of each post.
BRIAN: If you’re listening to this podcast you probably understand by now that digital marketing world and its community around it is all about knowledge sharing. Chris and I learned this world on our own. We didn’t go to school for it, it wasn’t even frankly in school when we were learning about this. But we learned it from reading others and listening to others. That’s part of the reason we are doing this podcast, to try to help you guys understand the lessons we learned along the way. Hopefully you’ll hit us up so we can learn from you guys.
CHRIS: Great ok, let’s go to How-to’s. So how to calculate LTV. Let’s say that you get it, you understand why you want to learn it, you understand why you need to zero in on this metric and understand it in it’s context relative to all the various other things you may be measuring in your business. First thing is, it’s going to be highly custom to your business, to every business. So BRIAN mentioned the athletic recruiting business, where there was generally one sale or one moment, or one big sale that was made, so a high value sale but only time sale.
BRIAN: A lifetime type of purchase
CHRIS: So that’s going to be a little easier to calculate as far as the revenue side of your LTV vs say somebody who you know sells a SAAS product where you’re hoping for annual retention and people pay you year over year over year, well you’ll have to understand your retention numbers and your churn numbers to really get a good sense of what each customer is worth over their lifetime because you’re going to have to understand how long they stay, how many times each person pays you. There are plenty of other business that sell physical things, like clothing things like that. It takes some time to have enough data to understand how often a person will buy over a year, two years, or five years. So now we get into the fact that you have to have a certain amount of data and we kind of talked earlier about how you need to start right away capturing your data so that you actually have cohorts of buyers who have gone through your cycle multiple times. So, a year plus will usually be a good one. We have a client who’s in the apparel business, and like a lot of apparel companies, physical good companies, they see a big spike in purchasing around Christmas time.
So for this example, let’s say they installed an advanced analytics platform like Mixpanel, in September 2014. And then in December 2014, November 2014, there’s a big spike in buyers because of Christmas. And then you go a year out, and you’re in December 2015 and you think about the fact that you have a year of data now, but Christmas is a huge event and we only have one Christmas season in our data so we don’t really understand what those people are behaving like when the just purchase at Christmas, or when they just purchase in September and December 2014.
In this case, once we got through that second Christmas season, we started to look back over now a year and a half or more of data, and we started to really see some interesting things. So it depends on the business, but the more data you have the better. It’s kind of like planting a tree. The best time to plant a tree is twenty years ago but the the second best time is today. If your data capture isn’t where it should be, then now is the time to go and try to fix that or refine it, so the more data you have the better. A year plus is best but you can start with what you have.

BRIAN: Or even just going back, if your data isn’t perfect, take a look at what you have and really trying to sort it out. Talking to maybe some outside sources. It might not be perfect, you might not come to a perfect LTV but like Chris mentioned earlier, these things are always changing. The key piece is trying to get to that number to unlock your ability to grow.
CHRIS: Perfect, and so you can make some assumptions if you don’t have enough data, work through the data you do have. Like BRIAN said, look back and maybe your data isn’t perfect but you can make some assumptions about what may have happened or did happen. Mark those down on a document or wherever you are recording or analyzing this. Then when 6 months passes you can come back and look at it, and see if you were right or if you were wrong and refine it now that you have 6 months more data.
And so you have to have a lot of data. It’s going to be very customized to your business. What kind of data do we need?
We’re going to do a different podcast at some point soon about analytics, we’ll talk about the difference between Google Analytics and some more advanced tracking platforms like Mixpanel and KISSmetrics. But, there’s a bunch of reasons why we love Mixpanel, at it’s basis Mixpanel is tracking people, and Google Analytics, as much as we love it, to date, is tracking sessions.
If BRIAN visits our website matchnode.com on his phone right now and then he goes back to his desk and checks it on his desktop work computer and then when he’s at home tonight on his tablet, Google is very likely to count that as three users and three sessions. Whereas if we have mixpanel properly installed and we have this sort of business where someone logs in and BRIAN is logged in to matchnode.com, mixpanel is going to recognize that on his mobile, on his work computer, and on his tablet it’s all the same person. So it counts BRIAN as one user.
BRIAN: And since I’ve come back to the website four different times
CHRIS: On these different devices
BRIAN: Why is that important for calculating LTV? It’s tracking purchase behavior across different devices.
CHRIS: Right, so when you tie the purchase behavior and revenue and sales numbers to actually people instead of website visits, now you’re starting to understand how many people have purchased and what that averages out to, or what’s the median revenue or the different kinds of analysis you can do on people-based revenue.
BRIAN: And just as important, you can tie your marketing costs to that purchase across multiple platforms.
CHRIS: Exactly. So let’s say now you have installed Mixpanel (or KISSmetrics is another one we like that’s pretty similar) and you have the data working, it’s capturing your revenue. It’s been running for a few months. What you’re going to start being able to do is kick out cohort reports first of all. Which is most common usage being you’ll be able to segment all your buyers by the month they signed up or the month they first purchased. So you’ll be able to look at people say, who purchased in January 2015 and watch how often they re-buy one month out, two months out, three months out, all subsequent months and start to really get a sense of your reorder rate.
In the case of someone who is buying say, clothing, you’re going to want to understand how often this person does this person rebuy? You might spend $50 in marketing costs to get them to make that initial purchase, but you need to know how many times that person is going to purchase so you can start to tie that back.
So once you’re able to kick out all this revenue, you can kick out now all this customer data over a certain time period. And then you want to sort it by total revenue per person. So, you have a big customer database, at top you’ve got people who’ve paid you the most money over this period of time, at the bottom you have people who have paid you the least over this period of time.
We’ve found it’s super useful to divide this into quarters, so you take your top 25%, your bottom 25%, two 25% groups in between. This is quartile analysis. You just cut it into groups of four. And you start to say, what is the median revenue gained in the top quartile, what’s the median revenue gained in the bottom quartile.
BRIAN: It even lets you dig into things like what Chris talks about all the time, finding your whales. I know you just went into that recently with your client. Can you talk about that a little bit, Chris?
Chris: We define whales as the top 1% of any group of buyers. So, your whales will be worth, hopefully some exorbitant amount relative to your top decile. Decile analysis is the same concept as quartile analysis but you’re using 10% groupings.
BRIAN: Talking about whales, think about a simple company, not a simple company, a complex company like Disney world. Whales will probably visit the theme park every year. But for many families it’s a once in a lifetime purchase. And they need to understand that so they can spread their marketing cost across all of them.
CHRIS: That’s a great example because Disneyworld is a one-time thing for many families and there are a lot of families that go every single year. There’s a lot of families that go to multiple Disney parks in the same year, there’s families that go to a Disney park and then go on a Disney cruise.
BRIAN: And then they buy ice cream, then they buy a t-shirt, then they go to a movie. And they tie all of that to a person.
CHRIS: And so a whale from Disney point of view, may spend $30,000 a year on Disney products and experiences, whereas you’ll have people in your bottom decile, who are going to spend way less money who may have bought a Disney figure.
BRIAN: Which is why they enable things like resort charges, and their RFID bracelets to track you all over the park, to understand and tie everything back to a person.
CHRIS: Now again you have people analytics, you have revenue analytics, you have marketing spend by person rather by visit and so you’ve lifetime value cohort reports, quartile, decile analysis.
And the great thing, the really powerful thing from a marketing cost standpoint, is that you can break up this LTV by channel. I spend money on Facebook, I spend money on google, I have some offline initiatives, I’m trying to tie them all together. I’m trying to figure out their relative success in driving high LTV customers to my business and this will allow you to start to see that clearly.
And then there’s a whole other can of worms about all these pieces overlapping and working together: the reality that the person may see four or five different channels. That gets in to multichannel attribution.
BRIAN: A topic for another day.
CHRIS: So let’s get to the giveaway. We’re going to give away one month of Mixpanel. $150 value. This will work best for companies with a certain level of traffic that will actually need this paid pricing tier. We’ll put a link to Mixpanel and this $150 value in the resources part of this podcast. Go to Snapchat, snap us a video with a question that you wanted some information from this podcast. We will answer all the questions on snapchat and we will then pick our favorite and inform them that they are the winner.
BRIAN: And by the way, Mixpanel isn’t paying us to say this, we aren’t sponsored by Mixpanel in any way. But we do recommend that any business install either Mixpanel or KISSmetrics or something like that, that starts to tie their data to actual people.
CHRIS: Great! Well, we look forward to hearing from you, we look forward to meeting and giving away this prize to whoever it is who hits us up on Snapchat and wins.
BRIAN: And I’m looking forward to more podcasts with you guys.
CHRIS: Absolutely, thanks a lot and we’ll talk you soon.
BRIAN: We’re out.
Resources:
—Lifetime Value Infographic from KISSmetrics
—mixpanel.com (winner of giveaway gets one month)
–intro and outro music from our friends at Sabers: https://sabersmusic.bandcamp.com/releases