Web Analytics and Maximizing Value
[0:32] (Google) Analytics 101: Pros and Cons
[2:34] Key GA Reports / Capabilities
[7:32] Ask Business Questions of the Data
[11:14] Customer Journey Analytics (ie People vs Session Based)
[14:26] Triangulation
[15:43] “About the Pod”
[18:20] Cohort Reports
[19:36] Retention
[22:28] Multi Touch Attribution
[24:55] Mixpanel, KISSmetrics
[26:17] Atlas, Google 360
BRIAN: Welcome to Matchcast I’m Brian Davidson
CHRIS: Chris Madden
BRIAN: What’s Going on Chris?
CHRIS: Uh, Not much, all good, same as last time.
BRIAN: We are here to talk today about analytics with you guys
CHRIS: One of our favorite topics.
BRIAN: So we’re going to start off obviously with Google analytics, if you haven’t heard of Google analytics I’d be shocked if you’re listening to this podcast.
Google analytics remains kind of the 101 for analytics and every site needs to have Google analytics on it.
CHRIS: It is the most basic have to have for any modern business that has any sort of web presence which is most. And then having Google analytics on your site is one thing, taking the first step to make sure a couple of the basic things are set up is a different issue.
We spend so much of our day in Google analytics. We love it, it’s great for many many reasons. With that said there are a couple of shortcomings, that we, certainly our analytics works extends far beyond Google analytics, and we’ll get into reasons why and some steps Google may be taking to try to change that. They have a veritable monopoly on web analytics at least in the West or the US. And there are more advanced analytics that we get into sometimes with clients that they are trying to get into.
BRIAN: Yeah we’ll get into that a little at the end. But starting off with Google analytics and some of the more advanced things you can be doing with Google analytics that you know a lot of people don’t take advantage of, from their reporting to their events, to their revenue tracking, there’s many many pieces to Google analytics that are the right piece for different businesses. And you need to identify what’s important to yours and deepen that implementation to start.
CHRIS: Yeah, and for example, some of the first things there that are key Google analytics capabilities are segmenting your traffic to your website based on if they are on desktop, or mobile, or tablet. That’s something that five years ago everybody was using Google analytics and that was much less of an issue. Now it’s probably one of the first things we look at when we get access to a new client’s analytics. Alright, let’s see what’s happening. What’s happening on mobile, and desktop. Where is the traffic, where are the sales coming from, if they are a business that does sell online?
So there’s a key report and a key capability that at least will show you how the two different device types are behaving.
BRIAN: Sure, and one of the other things we do immediately is start look at their traffic and where its coming from. The sources report and the medium report is so so important for a business to understand where you’re getting your traffic from. And most importantly you want to make sure your campaigns are coming in bringing proper UTMs into your global analytics so you can sort out your different marketing expense.
CHRIS: Yeah so there’s this kind of back and forth between diving into Google analytics especially at the beginning and seeing what you can find. And then jumping out of Google analytics and thinking about your business and thinking about things that are going on. You’ve got, say a firm running some social media marketing for you. You want to be able to see that clearly if you’re investing money in a firm to do that kind of work for you. You want to be able to look into Google analytics and go “aha!” they’re properly tagging all these posts therefore when I see a click from this particular post form a firm that I pay we can see what we’re getting back from that.
BRIAN: Even if you’ve had Google analytics on your site for a long period of time, it’s probably worth going back and looking at your implementation. I recently spoke to a business that had three different sets of Google analytics on their website and it was causing their bounce rate to be artificially low. The best way to implement Google analytics now is through something called Google tag manager which is very very easy and can eliminate a lot of the hassle that people were dealing with in the past.
CHRIS: Yeah Google tag manager is amazing, definitely deserves its own episode. You can spend a lot of time digging into what you can do with Google tag manager, it can really help as a marketer and help businesses run smoothly and have less wasted resources between dev. adding marketing tags and marketing making requests and then waiting for a week or so before something simple can get done.
So Google tag manager, we met a guy in San Diego at a digital marketing conference that was only a Google tags manager implementation.
CHRIS: So Google tag manager is great, it’s a little more advanced, though like Brian said, it does serve to simplify the source medium report is awesome, the other thing that we often are looking into goals, kind of goes without saying. You mentioned revenue tracking, that happens when you have e-commerce analytics properly enabled and set up to pass your revenue from your website and different transactions that are happening into Google analytics. So you can tie that data into all the other things analytics can do for you. Like mobile vs desktop, source medium channel like Brian mentioned.
The other thing we do go to a lot, just because it helps to from a common sense standpoint understand what’s going on again as you look at behavior. And the landing pages, from behavior or site content but it will show you how much traffic went to every single page.
And the landing page view is the same thing but for the first page someone saw on your website.
BRIAN: Let’s talk about the underrated pieces of Google analytics that you really like. For me it’s the navigation summary, looking at a specific page in the upper right, clicking that navigation summary and seeing where they’re most common to go to next. A lot of times people will just look at their traffic report and see their 10 most important pages.
But what’s just as important is seeing your most important pages, where do people go next? Are they going to the page you want them to go to? Are you sequencing your website correctly?
CHRIS: Yeah that’s a great one, I like filtering and segmenting, so there’s all sorts of ways you can cut the data depending on which report you’re looking at. Segmenting happens up top where you can say show me page traffic sources, or just show me organic traffic, or just show me people who came from mobile, or just show me people who passed through a particular subdomain. Just show me people who converted or just show me people who didn’t convert.
And you can look at any one of these reports just looking at that particular subset of your users that you created. Filters are kind of similar which usually when you’re into a report. For instance, let’s say you have tons of different referrers that are all essentially Facebook but there are a ton of different urls that really Facebook. You could have m.facebook, l.facebook, you could have UTM on the back of Facebook links that are having them come in different ways.
While you’re looking at this certain report, you’re really just wanting to see the facebook traffic, so within the filtering capability and the top right of your results, you would write “Facebook” and you would just see those results there.
BRIAN: Lump everything together.
CHRIS: Yeah, so there’s a lot there, it’s really the first thing you need to have to get a sense of what’s going on from a data standpoint on your website. One thing we find to be really important is when you first set up analytics for your own business or say in our case, we have a client who gives us analytics access for the first time. We definitely dig in and look at all these things just to see if anything jumps out of us and see what’s happening.
I find the tactic of just going in your analytics to see what’s up to lose value pretty quickly. We are big believers of once you know the lay of the land in your analytics and you trust the data, and you know the setup reasonably well, and you know what it all means and where to find everything. It’s much more important to start to ask business questions, or have business questions that pop up in discussions or pop up when you’re on the train or whatever the case might be. And then go “aha!” I can go and look at this report to get some sort of an answer on that question.
BRIAN: Right, it’s really making your analytics work for you. We talk about advanced implementation, and there’s so many things you can do with Google analytics, whether it’s goals, or events, or revenue reports or segments. There’s so many different pieces to this. But the most important piece to being with is the only reason it’s there is to help your business grow and help you be more efficient. Either growing, or marketing spend, or helping your web traffic help your business over all. So you really need to come into this with a question or a thought and use your analytics to help you deepen your understanding of that.
CHRIS: Right, because sometimes when you don’t have a question or thought or business issue you’re investigating, and then you go to your analytics, sometimes you find yourself going over the numbers, it’s overwhelming, your eyes start to glaze over and cross, and you’re like, “alright, I need to go out for a walk and not look at these numbers.”
BRIAN: I’ve been in meetings where these fancy marketing execs come in and they just start listing number after number for their analytics and they’re pointing to why they’re a great person and they understand the data behind the website. And really, really quickly the CEO’s eyes glaze over and he’s wiped away as yesterday’s news. Whereas when you can come into a meeting and understand exactly once piece, an important finding that your analytics pointed out, you’re going to look like a rock star.
CHRIS: Exactly, one important take away is probably going to always be worth a lot more than a bunch of numbers that all say slightly different things.
And so we clearly love Google analytics, hopefully you’re getting that. We wanted to talk a bit about, maybe not shortcomings but some limitations of Google analytics and what to do about them. And how in a fully mature business that has a mature analytics implementation and understanding and a business that truly trusts and knows what it’s data is and is a data driven organization, you’re going to have to go beyond Google analytics.
And so one thing that’s key is that Google analytics is session based.
BRIAN: What is a session Chris?
CHRIS: A session is every time someone comes to your website. And so a session would be, I visit our website on my phone. And then another session would be I visit our website on a different device, my work desktop in five minutes.
BRIAN: And Google can’t tell a difference can it?
CHRIS: Google doesn’t know the difference, it just knows session from this device, session from this device, session from this device. If I go back on my same browser on my desktop 5 times, Google will know that’s me because it’s cookied my browser and will count me as a returning visitor.
BRIAN: But if you go on Firefox and then come on Chrome, and then internet explorer…
CHRIS: Yeah, separate user each time. So they’re really tracking browsers.
BRIAN: And a lot of work computers and workstations will clear your cookies every single night.
CHRIS: Right, they’re tracking browsers that have cookies in them.
BRIAN: Exactly.
CHRIS: So, that’s a shortcoming. As great as Google analytics is, for all the reason we’ve touched on already, it’s a shortcoming, and it’s just really important to understand that, so when you do mention to the CEO this new finding you’ve come up with and uncovered and you’re excited about it, someone is going to inevitably ask you some tougher questions about what the data actually means. And you need to understand the limitations so you can present it properly and with the right mount of confidence.
BRIAN: Right so the Holy Grail is moving from session based to people based analytics.
CHRIS: Right, so how would you do that?
BRIAN: Well, there are a lot of different programs out there, the two most commonly known right now are Mixpanel and KISSmetrics. Coming down the line, Facebook is launching something called Atlas. Because Chris has Facebook enabled on his phone and Instagram on his phone and Facebook on his computer and WhatsApp on his tablet. Facebook starts to tie all their data together and market to actual people.
CHRIS: And people can do that because it’s the same Facebook account?
BRIAN: Because they’re all sharing the same data, from the install base from the computer to the phone, to the tablet. And they’re tying all the marketing spent from Facebook ads back to a specific person, and they use your website analytics to tie their Facebook spend to an actual person actually buying something on your website.
CHRIS: So do Mixpanel and KISSmetrics need to be on Facebook to actually use that? Or how does that relate to Facebook knowing who I am across devices?
BRIAN: Sure, Facebook is probably easiest for someone to wrap their heads around, because a lot of people, or probably the most people, it’s the most downloaded app in the world. Especially considering their properties like Instagram and WhatsApp that I mentioned earlier, they’re able to tie people together very very easily, but Mixpanel and kiss do this from a data point of view. And they’re also able to tie your tablet to your phone to your desktop altogether to an actual website and website behavior through a much more data point of view.
CHRIS: And so what would the benefits be of people-based analytics vs a session-based analytics, or what’s the benefit to the business knowing, having some sort of analytics set up where the people are identifiable across devices and across sessions?
BRIAN: The most important part from a lot of businesses’ point of view is tying together their website behavior: how many times they have to visit a site before they make a purchase. For other businesses it’s more important to tie a marketing spend to that person across different devices. For other businesses it’s to understand the differences in buying behavior on mobile vs desktop.
It really depends again on the business like we mentioned earlier, you need to be able to ask a business question. But really at the core of any business is people buying things. So you really need to understand who your customer is, what their pattern is, and eventually tying your marketing and revenue to that particular person.
CHRIS: Interesting, so in an advanced or in a case of a business that prioritizes this and being data-driven and it works well for their specific situation, in this hypothetical example. They have Google analytics, that’s properly implemented, you’ve got Mixpanel or KISSmetrics or something similar that ties all this activity to specific people rather than web browsers. And then almost every business in this hypothetical example would have a backend, would have their own first party data.
BRIAN: They’d have their own database or their own CMS in the backend
CHRIS: Or they’ve got active admin if it’s a login-based business, Shopify being a loose example of an e-commerce business that has a backend that captures a lot of data.
BRIAN: Or even WordPress has a lot of different plugins.
CHRIS: So the idea is you have three sources of data, and if something really important has come up and you think you may have found an important clue as to why something is happening or what’s going on. And before you run in to the CEO and tell him or her that you’ve found the meaning of life in the context of your business. You can check it across all three of these areas now. Go into your first party data and ask if this makes sense. Ask “Who is this person, what’s their email, let’s see if I can find them.”
Then go in to Mixpanel and see what they’ve done, when they first signed up, how many times they’ve purchased, whatever it is that you’re looking at.
BRIAN: It also let’s you check your work as you deepen your implementation across different things. Let’s say you are enabling revenue data for the first time in KISSmetrics, you can the go into your revenue data in Google analytics, do these line up? Then you can go to your revenue data in your backend, do these line up? And once you can triangulate that, you can trust the different reporting figures within each tool.
CHRIS: And then it becomes a really great resource on a go-forward basis where you can always have confidence that something is correct, or if it’s not, you have a way of checking it.
BRIAN: sure, confidence in your analytics is important.
CHRIS: Triangulation, one that we talk about a lot. Let’s go to about the Pod. We’re doing a giveaway every podcast. What are we giving away today Brian on this analytics episode?
BRIAN: Chris is the matchnode sales guru, and his favorite tool to date for matching his sales and pumping up matchnode sales, bringing clients in the door is using Pipedrive.
CHRIS: Yes, Pipedrive, been using Pipedrive relatively recently. We’re searching for the best way to deal with a pipeline, and Pipedrive has been amazing. And once I discovered it I we started to notice a lot of other people we like and respect also using it. We will give you one free month of Pipedrive.
BRIAN: Really quickly, what is Pipedrive?
CHRIS: Pipedrive is a CRM and it has a very visually intuitive pipeline where you make up your own pipeline based on the different pieces in your sales pipeline, the different phases of your sales pipeline. And you drag leads and deals from one phase of your sales pipeline to the next. It really keeps you on track as far as when certain activities are planned for certain leads. It allows you to manage a certain team of sales people where you have 20 people on your sales team, it let’s you see who’s doing what, who has what deals in what phases and their pipeline shows you analytics stats around how long people are on certain phases for your closed deals. What’s the average sales cycle, all this great stuff.
So in this analytics episode, it’s definitely a CRM with a really good sales pipeline analytics. So Pipedrive has been one of our favorites recently, so if you ask us a question on Snapchat about this episode, our Snapchat is MATCHNODE, ask us a question, we’ll answer all the questions that come through and we’ll pick our favorite question and give you one month of pipe-drive.
BRIAN: And a quick aside, if you’re asking why we’re doing this on Snapchat? It’s because that’s where your customers are going to be. I don’t like Snapchat, I barely use it, I’m on Snapchat because our customers are on Snapchat.
CHRIS: Yeah I love Snapchat, and we will, this is the fourth time we’ve said it’s a subject for another podcast, but we’ll talk about Snapchat another time. We talk about it a lot, some of us love it some of us don’t. But certainly a huge platform going forward.
So ask us the questions, win Pipedrive. You know what, let’s make it six months of Pipedrive. Six months of Pipedrive.

BRIAN: We’re going to wrap up our pod today with some of the important questions and reports that are going to come out of the people based analytics that we just touched on earlier. Initially we talked about the entire marketing spend and revenue spend and internet behavior to this people thing.
But let’s dive into some of the cool reports we like to use and show the different companies.
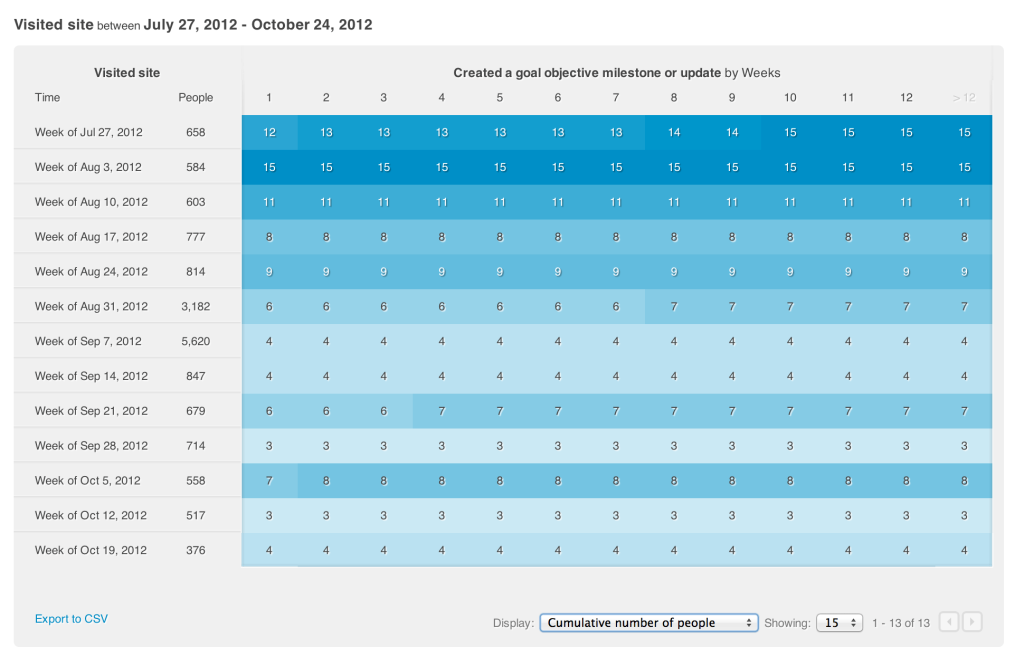
CHRIS: One would be the cohort report. The cohort report breaks your activity the most common cohorts are time based cohorts so basically you would look at month by month or week by week you could look back. Say your business launched on January 1, 2015 and you had everything, all these analytics implemented immediately on the day of your launch, which so many businesses do. And then you could look back and say for those people who signed up in January, how many of them are still with us. How many are we retaining, how many are still signing in? Six, Eight months out, nine months out, twelve months out.
BRIAN: Your Google analytics might be flat, or you might even begin growing.
CHRIS: Because you have some mix of returning and new visitors.
BRIAN: But if you’re not retaining those people, it’s usually a red flag for your business.
CHRIS: In some ways if you’re not retaining people in certain businesses then nothing else really matters.
So a cohort report can be a great measure for retention. So that’s one that we love and use very often. And then things like Mixpanel and KISSmetrics you can take your cohort reports and segment by source or properties. You can take only people who’ve bought more than two times, and look at when those people bought for the first time. You could look at people who came in from a Facebook ad, or people who clicked on a Facebook ad at any point in their life cycle. What are the chances that those cohorts, monthly cohorts are re-ordering? That’s the sort of comparison you want to do across channels.
People who come in more organically may order less or more on a re-order basis. Meaning you are trying to get people to order 2, 3, or 4 times in this hypothetical example, are people who come in organically more or less likely to reorder?
Interestingly we did this for a client that does a pretty large business in apparel and once we got to the point where we had enough data for them which takes in this case more than a year, about a year and a half of data collection in this advanced people-based analytics before we could take things apart. We wanted to get through two Christmas seasons because they have a huge Christmas spike. We found when we looked through all this, we found that 60-70% of their sales were only organic, meaning the purchasers had never clicked on a paid link, they never clicked on an ad, they never clicked on a link that had a UTM on it, meaning there was some sort of manual set up in that link at some point of someone from the business expecting a person to click on that and then buy.
What we found was pretty amazing, those who were purely organic, repurchased way, way, less than those who had clicked on an ad at some point. Whether it was Facebook or Google or marketing. And it was about 60-70% of the volume was purely organic, but of that 60 or 70% of those only organic customers they had about an 9% reorder rate. And the business globally had a 24% purchasing reorder rate. So we were like “Huh that’s clearly less” So we looked at the opposite group, so everyone who had touched ads it was like 150%. It was crazy.
It was just glaring, one of those things that just jumps out and as an ad agency it was good to see and the client I think was a little surprised by it. But it was one of those things we had confidence in it because we knew it was real.
BRIAN: At the time they were looking at pulling back on their ad spend a little bit, they weren’t sure if it was being totally effective, and this was one of those tools that told them they need to keep the pedal to the metal.
CHRIS: That is retention and cohort reports are highly linked and some of our favorites. What about customer journey analytics?
BRIAN: Customer journey analytics and especially attribution and multi-touch attribution, Chris kind of hit on in the last segment. And those are all possible with KISSmetrics and Mixpanel and Atlas and some of others we’ll talk about later like Google 360.
The customer journey and how long it takes someone to purchase, how many devices they are going to come to the site before they purchase, how they come back to your site. Trying to look at that customer journey and see how much time they spend on your site. And identifying key events on that journey. May it be downloading the PDF or learning a little bit more to your website, clicking on a chat app on your website. So you can really identify that journey across multiple devices and understand that behavior with those sorts of tools.
CHRIS: And sometimes the different devices and different channels that are driving the visit may fall at different places along the customers’ consideration journey of whether or not they are going to buy. So it might be that a social touch point, like somebody’s friend shares something on Facebook. The person might click that and it might be the first time they’ve heard of the company or heard of the solution and they are at the very top of their funnel, if you want to use that mental model. But the very top of the funnel and they haven’t considered purchasing yet, but their friend shared and they’re like “oh cool.” And maybe five days later they see it on the side of a bus or something and they’re somehow reminded of it, and they do a search for that particular business or maybe it’s the concept, maybe they can’t remember the exact name of the company, but maybe they remember the idea or where it’s located.
They’ll do a Google search, a brand search. From the business owner’s point of view, it’s “Oh they’re looking for my business” but they might not be able to connect it to the fact that the reason they’re looking for your business and know about it in the first place is because they found it on Facebook when their friend shared it. Now in this second visit when they did a search for your brand and they find it, now they get very serious about buying and now they’re deciding should I buy this product from you or that product from you?
And then two days later they’re like, “you know what? Forget it, it’s payday, I’ve got the money I’m going to buy the thing” and they go right to the site. You’ve got this piece of direct traffic that bought your thing on a Friday afternoon, and it’s like “oh, direct traffic, I’ve got a sale today, it came from direct, cool” So if you’re on Google analytics that might be all you get, but if you’ve got Mixpanel or KISSmetrics properly implemented, you’re going to say “Wait a minute, at the top of the funnel there was a social visit, then as they moved down the funnel there was a branded search visit, then at the bottom of the funnel there was a direct visit.”
So that’s a very different understanding and a much more nuanced understanding than a direct visit equals sales. Which a lot of people just expect, “Oh I got sales from direct.”
BRIAN: Yeah they saw my billboard and came to my website.
CHRIS: So Google has a great tool that we’ll put in the resources under their think with Google website, we really like it. It’s a tool that basically, you pick your industry whether it’s e-commerce or travel, or SAS. When you pick your industry it moves the channels around on a buy journey timeline. So again, things like social are going to be up front, things like direct are going to be at the end. That’s a mental model we use a lot, the customer path to purchase, and where these models lay out on that path.
BRIAN: Awesome, well then, wrapping up really quick, like we mentioned today, we really believe in tools like Mixpanel and KISSmetrics. The more advanced ones are like Atlas by Facebook that not everyone qualifies for at this point.
CHRIS: What’s up with Google 360?
BRIAN: That’s the red herring right in the room right now. Chris and I are chomping at the bit to get access to Google 360. If Google is listening to this, and they no doubt are, please give us a call right now. Google 360 is their attempt to solve a lot of the limitations we talked about earlier with Google analytics and their session based marketing. That’s something coming down the pipe people can get really excited about, but it speaks I think to the importance of this entire topic and why you should get past session-based and really look at people analytics.
CHRIS: Alright, well thank you very much for listening, Thank you Brian for your help. Look forward to more podcasts coming with guests. Please let us know if you like the podcast, if you don’t like the podcast, what other topics you might be interested in, that we might be able to help with or talk about, we really want to make this something that you like.
BRIAN: And remember, if you’re interested in getting some Pipedrive, boost your sales from a visual standpoint, please hit us up on Snapchat.
CHRIS: Yeah, Pipedrive calls itself CRM for small sales teams with big ambition. So if that’s you hit us up on Snapchat with questions about this podcast, we’ll pick our favorite. Not one month but six months of Pipedrive.
BRIAN: And we’re out!
Chris: See ya!
Resources:
–Think with Google: Customer Journey to Online Purchase
—pipedrive.com (winner of giveaway gets one month)
–intro and outro music from our friends at Sabers: https://sabersmusic.bandcamp.com/releases